| On this page |

APEX Script is a code interface for building APEX graphs. It uses a Python-like syntax to generate a graph that represents the code logic. APEX Script snippets can be written in the APEX Script SOP, which can take in inputs, execute the code snippet, and output the results. The APEX Autorig Component and
APEX Rigscript Component SOPs also provide an interface for writing APEX Script snippets.
APEX Script snippets have a direct representation as an APEX graph. As you type APEX Script code, you can see its graph representation being generated in the APEX network view:
APEX Script can be used as a tool to build new graphs, modify existing graphs, and retrieve graph data. See the following pages for more information:
-
Working with graphs shows how to use APEX Script to access and manipulate graph elements, add graph logic directly into another graph, and invoke other graphs from within a graph.
-
Create your own functions in APEX Script or use the built-in APEX functions within your code snippet.
-
The APEX Script language reference describes the syntax and language elements of APEX Script, including the provided types, operations, and statements.
Viewing APEX Script as a graph 
In APEX Script, BindInput() is a special function that defines the inputs to a graph. It creates a parms node with ports that represent the graph inputs. The BindOutput() function defines the graph outputs, and creates an output node with ports that represent the values that are output from the graph.
In this example, we write an APEX Script snippet that takes a value as an input, and outputs the same value:
-
Put the following snippet in an APEX Script SOP, Snippet parameter:
a = BindInput(3.5)

BindOutput(a)
-
To see the APEX Script snippet represented as a graph, open up the APEX network view. At the top of a pane, click the
New Tab icon and select New Pane Tab Type ▸ Animation ▸ APEX Network View.
-
On the APEX Script SOP, Visualizer section, set Show to Component Script.

APEX Script code represented as a graph
View graph inputs 
To view the graph input values:
-
In the geometry spreadsheet, beside the node name, select Apex Script Graph from the drop-down menu.
or
Connect the 2nd output (APEX Script Graph output) of the APEX Script SOP to a
Null SOP, and select the Null SOP.
-
In the geometry spreadsheet, click
Detail on the top toolbar. The input parameters are stored in the
parmsdetail attribute on the graph.
If you click on the Reload Setup Parms button in the APEX Script SOP, the graph inputs appear in the parameter editor as parameters that you can adjust.
View graph outputs 
To view the graph output values:
-
By default, the first entry of Output Dictionary Bindings on the APEX Script SOP, Invocation section is filled out with the following:
-
Apex Outputs Group is the set to
output. This is the name of the output node in the graph. -
Output Attrib is set to
parms. This is the name of the output to store in a dictionary format. We can set this to any name.
-
-
In the geometry spreadsheet, beside the node name, select Invoked from the drop-down menu.
-
Click
Detail on the top toolbar. The graph outputs are stored in the dictionary specified in Output Attrib.
Building a new graph 
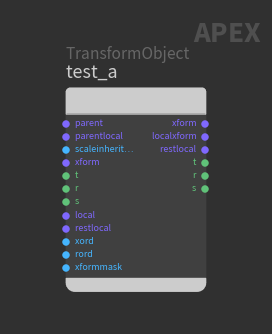
In this example, we use APEX Script to create a new graph that contains a single TransformObject node:
-
In an APEX Script SOP, add the following code to the Snippet parameter:
# Initialize a graph graph = ApexGraphHandle() # Add a TransformObject node to the new graph graph.addNode('test_a', 'TransformObject') # Write out the graph as geometry geo = graph.writeToGeo() BindOutput(geo) -
See the graph representation of the APEX Script snippet in the APEX network view. On the APEX Script SOP, Visualizer section, set Show to Component Script:

APEX Script as a graph -
To output the graph as a geometry, set Bind Output Geometry to
<output_node>:<output_port>. In our case, it isoutput:geo. -
To see the new graph created by the APEX Script snippet:
-
On the APEX Script SOP, Visualizer section, set Show to Output 1.
or
-
Connect the 1st output of the APEX Script SOP to a
Null SOP, and select the Null SOP.

Graph created by APEX Script
-
Modifying an existing graph 
In this example, we use APEX Script to add a TransformObject node to an existing graph:
-
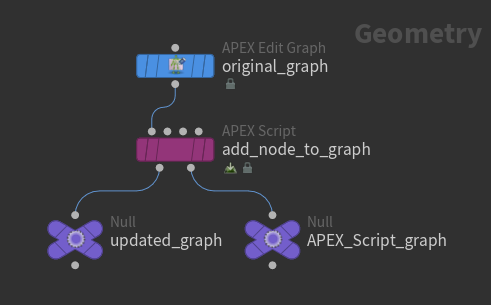
Create a graph in an
APEX Edit Graph SOP that contains only an input and output node:

Original graph -
Connect the graph as an input to an APEX Script SOP:

Update original graph -
In the APEX Script SOP, use the predefined headers to automatically add the APEX Script commands that take in and modify an input graph:
-
Turn on the Header parameter.
-
In the Header section, set Template to Graph, which adds the following code to the beginning and end of your APEX Script snippet:
Header
geo: Geometry = BindInput()
graph = geo.loadFromGeo()
-
-
Specify the input to the APEX Script SOP. In the Invocation section, under Input1 Bindings, turn on Bind To Geometry Parameter, and set the parameter to
geo.geois the graph geometry that is input to the APEX Script SOP, specified in the header from the previous step. -
To output the updated graph, set Bind Output Geometry to
output:geo. -
The APEX Script SOP now takes in the input graph and outputs it unchanged. To see the graph that is output by the APEX Script SOP:
-
On the APEX Script SOP, Visualizer section, set Show to Output 1.
or
-
Connect the 1st output of the APEX Script SOP to a
Null SOP, and select the Null SOP.
-
-
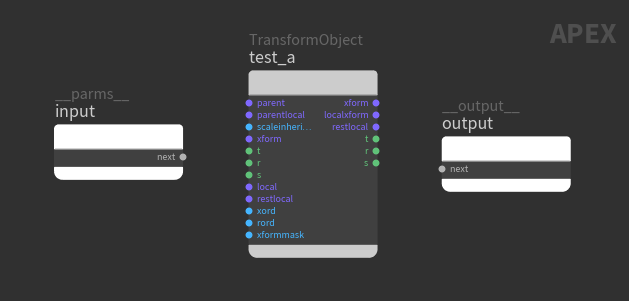
To add a TransformObject node to the input graph, put the following code in the Snippet parameter:
graph.addNode('test_a', 'TransformObject')
Updated graph
How-to 
| To... | Do this |
|---|---|
|
Make code changes take effect |
After making changes to the code snippet, press ⌃ Ctrl + Enter. |
|
View the graph nodes that are associated with the APEX Script line number |
|
|
Lay out the nodes in a graph |
Add |
|
Comment or uncomment a block of code |
Select a block of code and press ⌃ Ctrl + /. |
|
Change the code snippet font size |
Click inside the Snippet parameter and press ⌃ Ctrl + + or ⌃ Ctrl + -. |
|
Convert a graph to APEX Script code |