| On this page |
|
This page gives step-by-step instructions on how to create and execute APEX graphs for numerical operations like adding two values, fetching multiple results, and retrieving information from geometry. The examples on this page follow the basic structure of:
-
How to create the graph logic.
-
How to evaluate (execute) the graph.
Add two values 
This example shows how to create a graph that adds two values. We will go through the basic workflow of how to input data into the graph and how to view the output of the graph.
Create the graph logic 
Create the graph logic to add two values, a and b.
Manually create the graph 
-
At the geometry level, put down an
APEX Graph SOP in the network editor.
-
With the APEX Graph SOP selected, open the APEX network view. The APEX network view can write directly to the APEX Graph SOP.
-
In the APEX network view, create a graph that performs a simple numerical operation:
-
Add the graph input and output nodes:
-
Add the node that takes in the input parameters. Press TAB to bring up the TAB menu and search for Input. A
__parms__graph input node will be added to the graph. -
Add the graph output node by searching for Output in the TAB menu.
-
-
Add an
Add<Float> node to perform a simple add operation.
-
Connect the nodes as shown below. On the
addnode, b is a variadic port, so you can make multiple connections to it, and subports named b<x> will be created:Connect nodes in the APEX network view
-
At this point, the graph is only a piece of logic represented as geometry. The inputs of the graph have not been defined and the graph is not being evaluated or calculated, so there is no output or result.
Create the graph using APEX Script 
-
At the geometry level, put down an
APEX Script SOP in the network editor.
-
Put the following snippet in the APEX Script SOP, Snippet parameter:
a = BindInput(Float())
b = BindInput(Float())

result = a + b

BindOutput(result)
-
To see the APEX Script snippet represented as a graph, open up the APEX network view. At the top of a pane, click the
New Tab icon and select New Pane Tab Type ▸ Animation ▸ APEX Network View.
-
On the APEX Script SOP, Visualizer section, set Show to Component Script.
APEX Script inserts
Null nodes after graph inputs to ensure that the incoming types are well-defined. Values are passed through Null nodes unmodified:
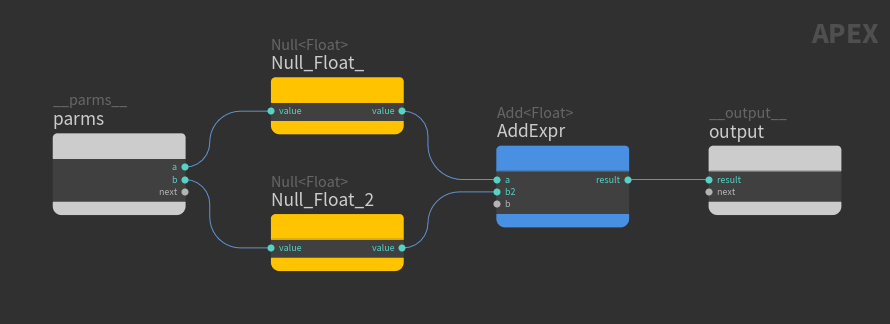
APEX Script code represented as a graph
Define the inputs 
We now define the inputs, a and b, of the addition operation. Numerical inputs must be stored in a dictionary format, so the dictionary is essentially a container of our input data. A dictionary stores a set of key-value pairs, and in our case, a and b are the keys. We use an Attribute Adjust Dictionary SOP to create a dictionary for the input parameters:
-
On the Attribute Adjust Dictionary SOP, Set Values section, create two entries by clicking
beside Number of Entries.
-
For the 1st entry, set the following:
-
Key:
a -
Type: Float (we are adding float values)
-
Value: Assign a value to
a.
-
-
For the 2nd entry, set the following:
-
Key:
b -
Type: Float
-
Value: Assign a value to
b.
-
By default, Attribute Name is set to parms, and Attribute Class is set to Detail, so we have a detail attribute called parms. This new parms attribute can be viewed in the geometry spreadsheet:
-
At the top of a pane, click the
New Tab icon and select New Pane Tab Type ▸ Inspectors ▸ Geometry Spreadsheet.
-
Select
Detail from the top toolbar.
Evaluate the graph logic 
We have now defined the graph logic as well as the graph inputs. To invoke (or evaluate) the graph, use the APEX Invoke Graph SOP.
-
Connect the node network:
-
The 1st input of the APEX Invoke Graph SOP takes in an APEX graph. In the network editor, connect the APEX Script SOP (2nd output, which contains the graph) to the APEX Invoke Graph SOP (1st input). If manually creating the graph logic, replace the APEX Script SOP with an APEX Graph SOP.
-
The 2nd input of the APEX Invoke Graph SOP takes in the data we want to use as inputs. They could be numerical values in a dictionary format, or regular geometry. Connect the Attribute Adjust Dictionary SOP to the APEX Invoke Graph SOP (2nd input).

Network to add two numerical values using a graph -
-
Specify the inputs in the APEX Invoke Graph SOP:
-
Add an input by clicking
beside Input Bindings.
-
By default, Dictionary To Bind is turned on and set to
parms. This is what we want because earlier, we had used the Attribute Adjust Dictionary SOP to define our input as a dictionary calledparms.
-
-
Specify the outputs to fetch in the APEX Invoke Graph SOP:
In this case, we are fetching numerical values (not geometry), so specify an output to fetch by clicking
beside Output Dictionary Bindings. The output is stored in a dictionary format.
-
Apex Outputs Group is the name of the output node in the graph. In our case, it is
output. -
Set Output Attrib to a name for the output dictionary, for example,
output_parms.
The new
output_parmsdictionary holds the calculated results. It can be viewed in the geometry spreadsheet by selectingDetail from the top toolbar. The
output_parmsdictionary has the keyresult(the name of the port on the graphoutputnode) set to the valuea+b.The APEX Invoke Graph SOP evaluates the logic from the APEX graph and gives you the result. If you change the values of
aand/orbin the Attribute Adjust Dictionary SOP, the output dictionary calculated by the APEX Invoke Graph SOP is updated to the new sum. -
Fetch two results 
We now take the graph logic from the previous example, perform another operation on the original result, and fetch the two results.
Create the graph logic 
Manually create the graph 
-
In the APEX network view, create the below graph. The subports on the
divideandoutputnodes have been renamed. The b port on thedividenode is a variadic input:
Graph logic that outputs two results -
Set the values on the
dividenode:-
Select the
dividenode and press P to bring up the node parameter window. -
divideperforms the operation a divided by b. In the node parameter window, set the value of a to1.0. The value of denominator comes from the previous addition operation.
-
Create the graph using APEX Script 
-
Put the following snippet in an APEX Script SOP, Snippet parameter:
a = BindInput(Float())
b = BindInput(Float())

add_result = a + b

add_divide_result = 1.0/add_result

# Output multiple results
BindOutput(add_result, add_divide_result)
-
View the APEX Script snippet as a graph in the APEX network view (red nodes are new). There are now two connected ports on the
outputnode: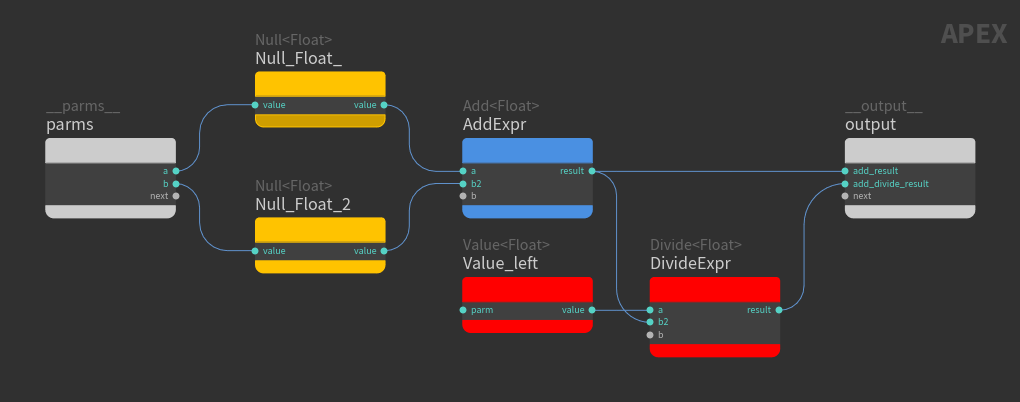
Graph logic that outputs two results
Evaluate the graph logic 
The graph inputs remain the same, so nothing needs to change in the Attribute Adjust Dictionary SOP.
For the graph outputs, the APEX Invoke Graph SOP is still fetching from the graph output node as it was doing previously. The difference now is that instead of getting just one result (the sum of the two inputs in add_result), we are also getting a second result (the outcome of the divide operation in add_divide_result). In SOPs, both results end up in one dictionary.
In the geometry speadsheet, view the values that are fetched from the graph output node:
-
Select the APEX Invoke Graph SOP in the network editor.
-
In the geometry spreadsheet, select
Detail from the top toolbar.
-
Two values are fetched from the
outputnode - add_result and add_divide_result.
Note
The output dictionary contains all the results on the graph output node specified in the APEX Invoke Graph SOP parameter Apex Outputs Group.
Partial evaluation 
In this example, we introduce the idea of partial evaluation, where we only get the outputs that we ask for. Only those outputs are calculated, and the rest of the graph logic is ignored.
Create the graph logic 
We start with the add-divide graph logic from the previous example, add another output node, and give it a different name from the original output node:
-
Put the following snippet in an APEX Script SOP, Snippet parameter:
a = BindInput(Float())
b = BindInput(Float())

add_result = a + b

add_divide_result = 1.0/add_result

multiply_result = 2.0 * add_divide_result

BindOutput(add_result, add_divide_result, __name='output')

BindOutput(multiply_result, __name='output2')
__nameis a special function argument used to name nodes. -
View the APEX Script snippet as a graph in the APEX network view (red nodes are new):
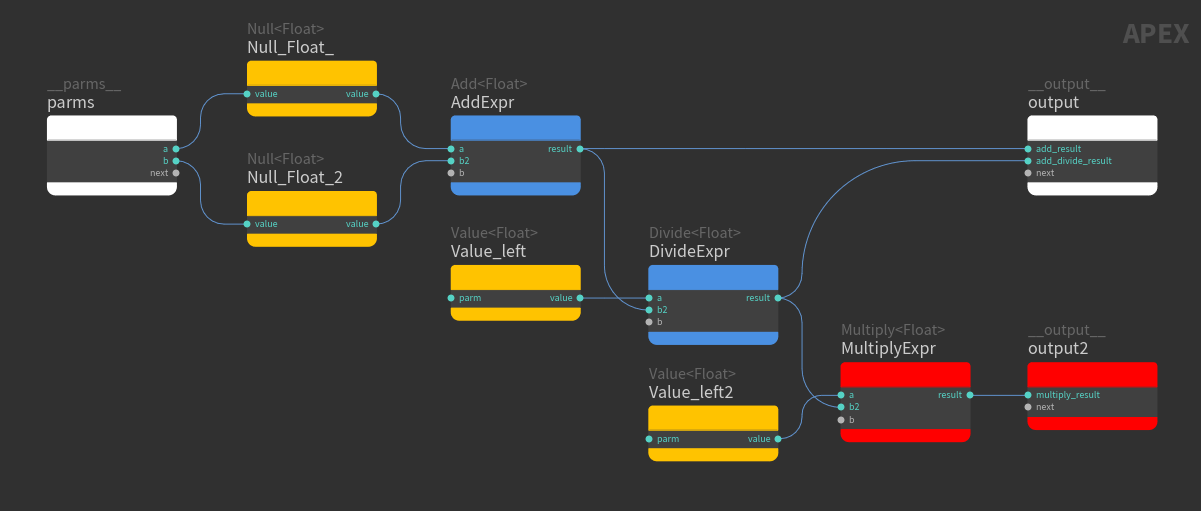
Partial evaluation of graph logic
Evaluate the graph logic 
View the values that are being fetched:
-
Select the APEX Invoke Graph SOP in the network editor.
-
In the geometry spreadsheet, select
Detail from the top toolbar.
Only the values from the original output node are being fetched even though we have another output node in the graph. Partial evaluation is happening here, where only the path through the graph logic to the output node is exercised. The logic that calculates the output2 values is ignored.
To also fetch the values from the new output node, output2:
-
In the APEX Invoke Graph SOP, click
beside Output Dictionary Bindings to add another output node to fetch from.
-
In the new Output Dictionary Bindings entry:
-
Set Apex Outputs Group to
output2. You could also selectoutput2from the drop down box. -
Set Output Attrib to a name for the output dictionary, for example,
output2_parms.
-
-
View the values that are now being fetched:
-
Select the APEX Invoke Graph SOP in the network editor.
-
In the geometry spreadsheet, select
Detail from the top toolbar.
The values from the two output nodes,
outputandoutput2, are now being calculated, fetched, and stored in two dictionaries,output_parmsandoutput2_parms. -
Modify geometry based on a numerical operation 
This example shows how to modify the size of a box geometry based on the result of an add operation.
Create the graph logic 
-
Put the following snippet in an APEX Script SOP, Snippet parameter:
a = BindInput(Float())
b = BindInput(Float())

result = a + b

# add_result affects the size of the box
geo = apex.sop.box(scale=result)

BindOutput(result, geo)
-
View the APEX Script snippet as a graph in the APEX network view. The sum of the add operation affects the size of the box:
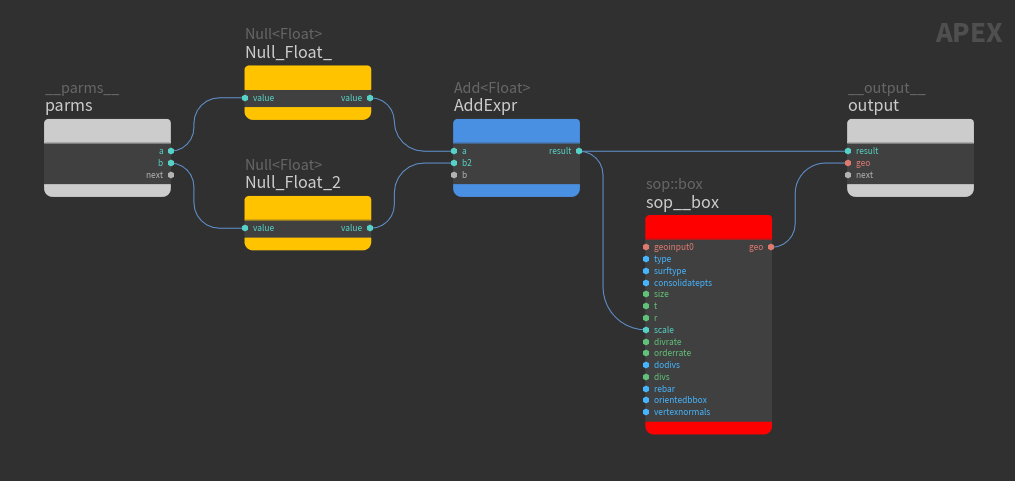
Numerical operation affects the size of the box geometry
Evaluate the graph logic 
This time, we want to fetch geometry instead of numerical values. To see the box in the viewport, we need to fetch the box geometry on the output node:
-
In the APEX Invoke Graph SOP, turn on Bind Output Geometry and set its value to
output:geo(<name_of_output_node>:<geometry_on_output_node>). -
Set the display flag on the APEX Invoke Graph SOP to see the box in the viewport.
-
Select the Attribute Adjust Dictionary SOP to see the graph input parameters,
aandb, in the parameter editor. Keep the display flag on the APEX Invoke Graph SOP. If you adjust the values ofaandbon the Attribute Adjust Dictionary SOP, the size of the box will change in the viewport.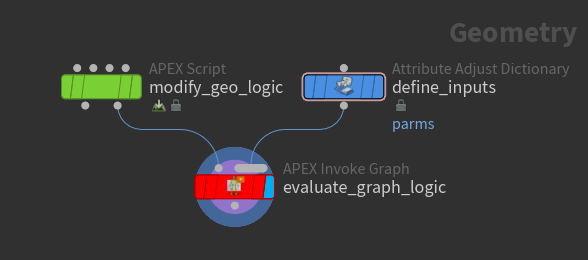
Network to adjust the input parameters and view the geometry
Retrieve and use information from geometry 
We can retrieve information from a piece of geometry to perform additional operations using that information. In this example, we place a sphere at one corner of a box, and as we change the input parameters, the size of the box and sphere both change.
Create the graph logic 
We add to the box geometry graph from the previous example.
-
Put the following snippet in an APEX Script SOP, Snippet parameter:
a = BindInput(Float())
b = BindInput(Float())

# add_result affects the size of the box
add_result = a + b
box_geo = apex.sop.box(scale=add_result)

# Sets box_point to the position (attribute 'P') of point 0
# (one of the corners) on the box
box_point = box_geo.pointAttribValue(0, 'P', valuetype=Vector3)

# multiply_result affects the size of the sphere
multiply_result = 0.5 * add_result

# Transform, t, of the sphere is set to box_point, so the
# center of the sphere is at box_point
sphere_geo = apex.sop.sphere(t=box_point, scale=multiply_result)

# Merge the box and sphere geometries
box_sphere_geo = apex.geo.mergePacked(box_geo, sphere_geo)

BindOutput(add_result, box_geo, box_point, box_sphere_geo)
-
View the APEX Script snippet as a graph in the APEX network view (red nodes are new). The sphere is placed at a specified corner of the box geometry, and the sphere and box are merged as one geometry to output:
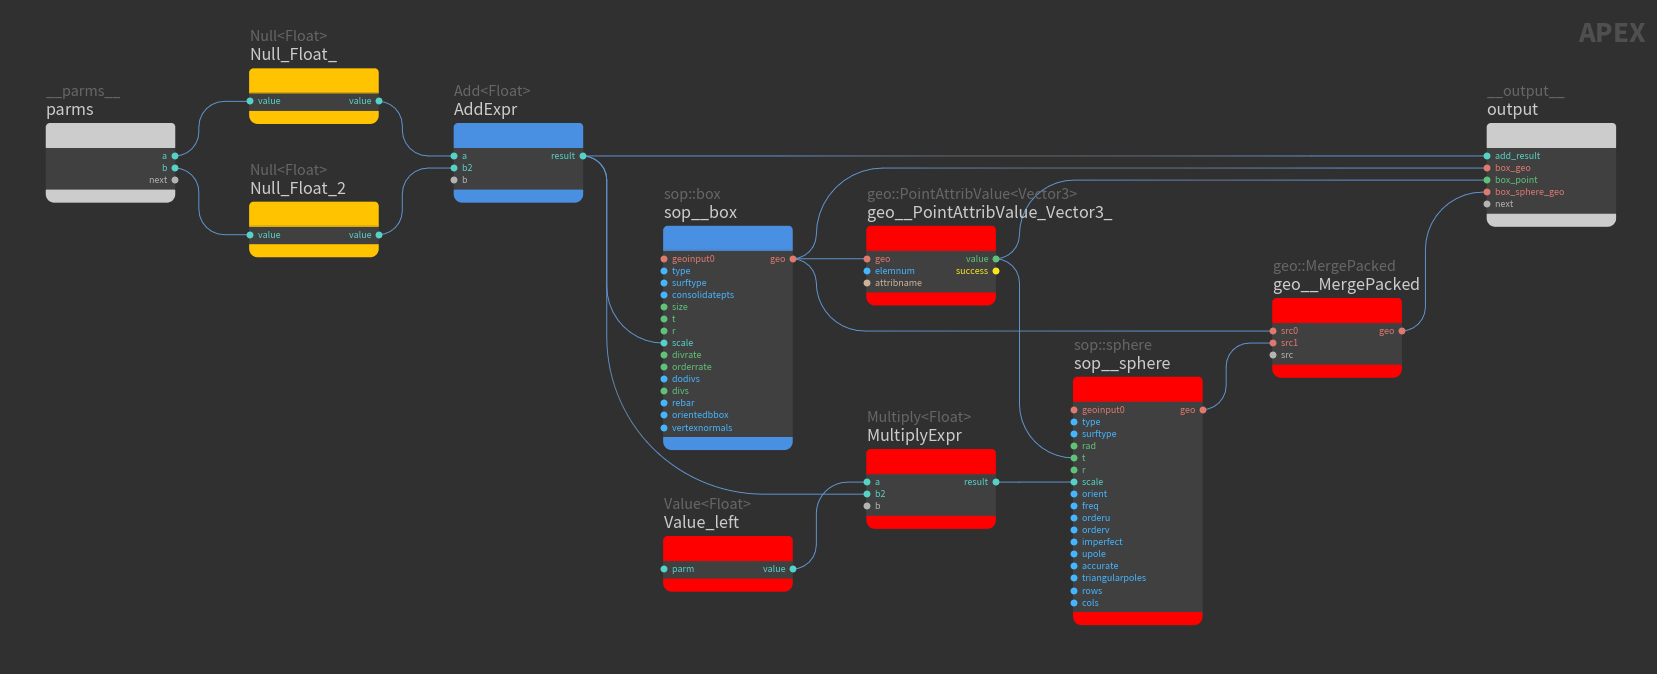
Retrieve information from a box geometry to perform additional operations
Evaluate the graph logic 
To view the box and sphere together, we need to fetch the merged box and sphere geometries on the output node:
-
In the APEX Invoke Graph SOP, turn on Bind Output Geometry and set its value to
output:box_sphere_geo(<name_of_output_node>:<merged_geometry_on_output_node>). -
Set the display flag on the APEX Invoke Graph SOP to see the box and sphere in the viewport.
-
Select the Attribute Adjust Dictionary SOP to see the graph input parameters,
aandb, in the parameter editor. Keep the display flag on the APEX Invoke Graph SOP. If you adjust the values ofaandbon the Attribute Adjust Dictionary SOP, the size of the box and sphere will change in the viewport.Sphere stays at a point on the box
How-to 
| To... | Do this |
|---|---|
|
Fetch numerical values from a graph |
On the APEX Invoke Graph SOP, specify the values to fetch:
The output dictionary can be viewed in the geometry spreadsheet by selecting See the example for adding two values. |
|
Display geometry from a graph |
See the example for modifying geometry. |